机器学习 - Data Processing
Line Separability
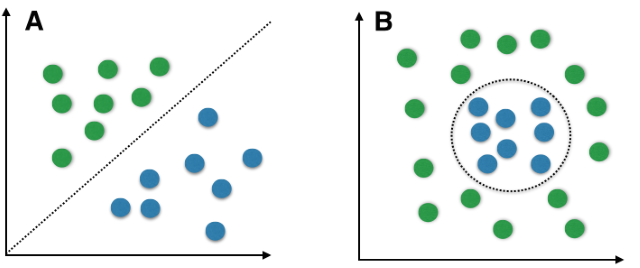
许多的模型假设了数据特征是线性可分的,但是实际上数据不一定符合该假设。这种情况在非结构化数据中尤为常见,如图像、时间、文本数据。
假如特征非线性可分,那么就不能得到好的线性模型的学习结果,需要更加复杂的模型。
如何判断线性可分性:
图像化,但是只适用于低维度数据集
Computational metrics
Linear Soft-Margin SVM
Reduce dimensions (LDA, PCA), then visualize separability
如何缓解:
找到真正有用的特征
- Feature Extraction (collect new features of the data)
- Feature Selection (keep fewer, more useful features)
特征变换
Feature Engineering (e.g., x → x2)
Change Basis Vectors (e.g., PCA, LDA)
Kernel (e.g., Kernel SVM)
Feature Learning (e.g., Neural Networks)
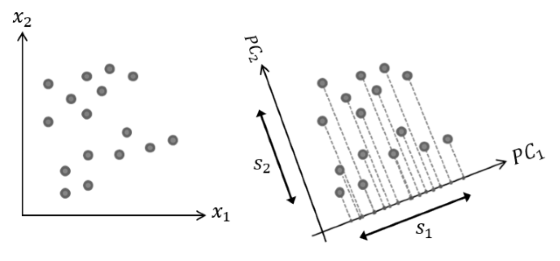
Principal Component Analysis (PCA)
\[
\begin{pmatrix}
x_{1} \\
x_{2} \\
\end{pmatrix}
\overset{\begin{matrix}{\mbox{PCA}}\\{\mbox{Projection}}\\ \end{matrix}}{\rightarrow}
\begin{pmatrix}
{PC}_{1} \\
{PC}_{2} \\
\end{pmatrix}
\]
\[
S_1 > S_2
\]
\[
\begin{pmatrix}
{PC}_{1} \\
{PC}_{2} \\
\end{pmatrix}
\overset{\begin{matrix}{\mbox{Reduce}}\\{\mbox{Dimensions}}\\ \end{matrix}}{\rightarrow}
\begin{pmatrix}
{PC}_{1} \\
\end{pmatrix}
\]
Maximize Data Variance
Good for supervised learning and unsupervised learning
Linear Discriminant Analysis (LDA)
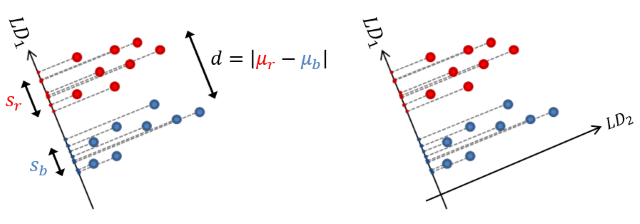
\[
F = \frac{|\mu_r - \mu_b|^2}{s_r^2 + s_b^2}
\]
\[
\begin{pmatrix}
x_{1} \\
x_{2} \\
\end{pmatrix}
\overset{\begin{matrix}{\mbox{LDA}}\\{\mbox{Projection}}\\ \end{matrix}}{\rightarrow}
\begin{pmatrix}
{LD}_{1} \\
{LD}_{2} \\
\end{pmatrix}
\]
\[
F_1 > F_2
\]
\[
\begin{pmatrix}
{LD}_{1} \\
{LD}_{2} \\
\end{pmatrix}
\overset{\begin{matrix}{\mbox{Reduce}}\\{\mbox{Dimensions}}\\ \end{matrix}}{\rightarrow}
\begin{pmatrix}
{LD}_{1} \\
\end{pmatrix}
\]
Maximize Class Separation
Better for supervised learning but not for unsupervised learning
Curse of Dimensionality
特征的数量太大时:
数据过于稀疏,无法获得真正的决策边界(对于分类来说),也很容易造成过拟合。
数据间距离过于接近,影响 kNN,clustering 等的表现。
如何判断维度过多:
Visualize histogram of distances (check for variance σ2) 但是一般来说分析这个会很繁琐
如何缓解:
Feature Selection
Dimensionality Reduction
Linear Matrix Factorization (e.g., PCA, LDA)
Deep Auto-Encoders
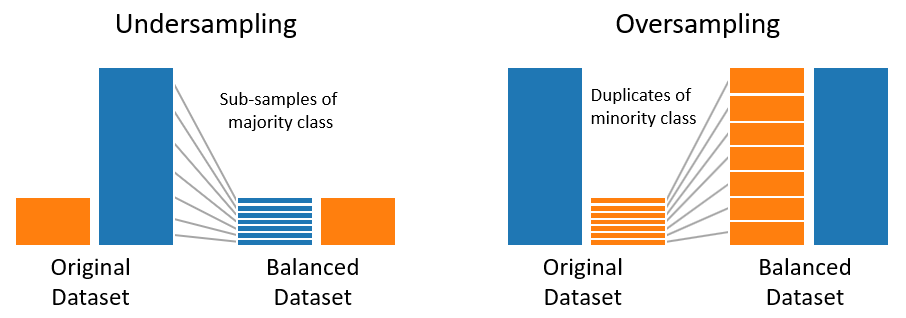
Imbalanced Data
数据值在特征中不是均匀分布的,在这种情况下,评价指标会产生误导,模型会过拟合至多数类。
事件发生不均匀(比如罕见的疾病),或者数据收集不均匀,都有可能造成这个问题。
如何判断数据不平衡:
Visualize histogram or bar chart of feature values
如何缓解:
Collect more data instances
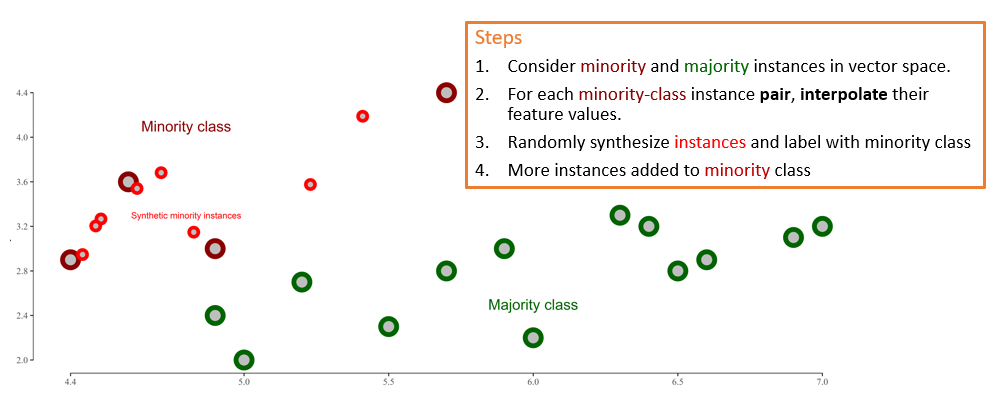
Resample instances (e.g., Undersampling, Oversampling, SMOTE)
Synthetic Minority Oversampling Technique (SMOTE)
 wechat
 alipay